Calculate the relative frequency of Tails, by working out the fraction of \(\text{20}\), the decimal fraction and the percentage.
Learner-dependent answer.
|
Previous
7.1 Introduction and key concepts
|
Next
7.3 Fair and unfair games
|

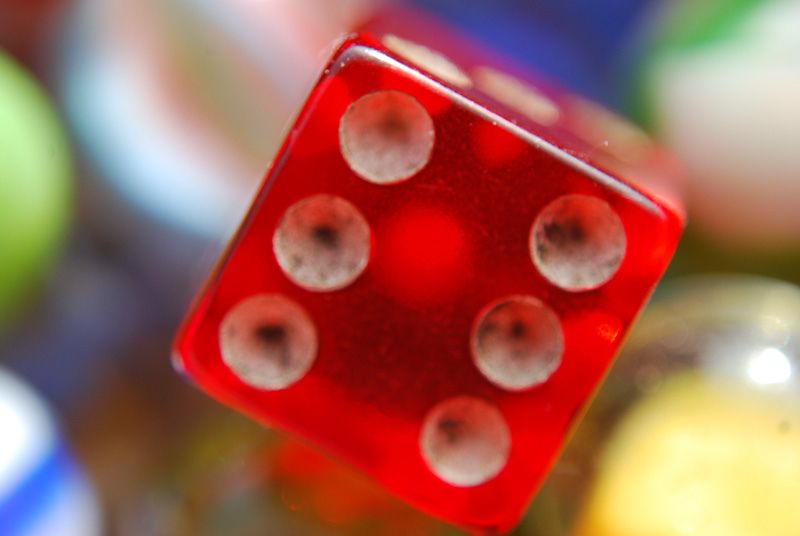
Probability games, for example using coins and dice, help us to understand probability better. These games work with random events, so they are a useful way to learn how to use probabilities to predict events.
Two important points make games of chance useful for learning about probability:
First, the events in probability experiments are random. This means that they cannot be deliberately influenced in any way (provided that the game is fair!). There is no way of making a fair dice fall on one number rather than another.
Second, each possible outcome has an equal chance of occurring. All the numbers on a dice have exactly the same chance of coming up when the dice is tossed: i.e a \(\text{1}\) in \(\text{6}\) chance.
Because of these two facts, we know that when we toss a coin, we have a \(\text{50}\%\) or \(\text{0,5}\) or \(\frac{\text{1}}{\text{2}}\) chance of getting heads, and a \(\text{50}\%\) or \(\text{0,5}\) or \(\frac{\text{1}}{\text{2}}\) chance of getting tails.
Similarly, on a dice, there is a \(\text{1}\) in \(\text{6}\) chance of throwing a \(\text{1}\); \(\text{2}\); \(\text{3}\); \(\text{4}\); \(\text{5}\) or \(\text{6}\).
This chance is called the theoretical probability.
When you do a probability experiment, such as tossing a coin a number of times, you find the relative frequency of each outcome. For example, if you toss a coin \(\text{10}\) times and you get Heads \(\text{3}\) times, then the relative frequency is simply \(\text{3}\) in \(\text{10}\) or \(\frac{\text{3}}{\text{10}}\).
An outcome is the result of a single trial. For example, if I roll a dice, one outcome would be a \(\text{6}\). An event is a collection of one or more outcomes. Using the example of rolling a dice, an event might be rolling an even number. Thus this event consists of any of the outcomes \(\text{2}\); \(\text{4}\); \(\text{6}\).
Work in groups to carry out the following experiment and record your results. You will need coins and dice for each group.
Each of you should flip a coin \(\text{20}\) times. Record your results in a tally table like this:
Tally | Total | |
H | ||
T |
Calculate the relative frequency of Tails, by working out the fraction of \(\text{20}\), the decimal fraction and the percentage.
Learner-dependent answer.
How does this compare to the theoretical probability of \(\text{50}\%\)?
Learner-dependent answer. Learners may find it quite confusing that they do not get \(\text{50}\%\) Tails.
Now put all your results together. Work out the relative frequency of Tails as:
a fraction out of \(\text{100}\).
Learner-dependent answer.
a decimal fraction.
Learner-dependent answer.
a percentage.
Learner-dependent answer.
Do the combined results get closer to \(\text{50}\%\) than your results on their own?
Learner-dependent answer. We expect that a higher number of trials gives an answer closer to \(\text{50}\%\). Allow plenty of time for a class discussion about this.
What was the relative frequency of Heads in each case?
Learner-dependent answer. Some learners may realise that the frequency of Heads will be complementary to the frequency of Tails (the two totals together equal \(\text{1}\) or \(\text{100}\%\)).
What is the theoretical probability for each outcome when you throw a dice? In other words, what fraction describes how often you expect to get each number?
\(\frac{\text{1}}{\text{6}}\)
Draw up a table for all the possible outcomes for throwing a dice.
Learner-dependent answer.
Throw the dice \(\text{50}\) times and keep a tally of the results.
Learner-dependent answer.
Calculate the relative frequency of each outcome.
Learner-dependent answer.
How do the answers in d) compare to the expected probability in a)?
Learner-dependent answer. Here again, learners will see that the frequency is different to the actual probability.

Dice with eight sides
Most dice are cubes, which means that they have six identical faces. It is also possible to get dice with different numbers of faces. As long as all of the faces are the same shape and size, the dice should still be fair.
The photograph above shows some dice with \(\text{8}\) faces.
List the possible outcomes when throwing one of these dice.
\(\text{1}\); \(\text{2}\); \(\text{3}\); \(\text{4}\); \(\text{5}\); \(\text{6}\); \(\text{7}\); \(\text{8}\)
What are the theoretical chances of throwing a “\(\text{7}\)” on one of these dice?
\(\text{1}\) in \(\text{8}\) or \(\text{12,5}\%\) or \(\text{0,125}\)
Is it more likely that you will get an even number on these dice than on normal \(\text{6}\)-sided dice? Explain.
The chance is the same, as there are the same number of even numbers and odd numbers on each type of dice.
Work in two groups to carry out a new probability experiment. Colour in some paper disks red and blue. One group should make \(\text{8}\) red disks and \(\text{4}\) blue disks. The other should make \(\text{4}\) red disks and \(\text{4}\) blue disks.
Put the disks into a closed box or bag and take turns to draw a disk out and note down which it is. (Remember to put the disk back each time.)
Learner-dependent answer
Draw up a table and record your results.
Learner-dependent answer.
Write a few sentences to describe the difference in the two groups' results.
Learner-dependent answer.
|
Previous
7.1 Introduction and key concepts
|
Table of Contents |
Next
7.3 Fair and unfair games
|